10 Steps To Effective Restaurant Accounting
Learn the 10 steps to effective restaurant accounting and discover one overlooke...

Data is a powerful tool for the success of your business. It can tell you where you’ve been, where you are, and even where you’re going. To get a clear idea of where your business is headed, you need a sales projection template.
In this article, the experts at Sling show you how to use a sales projection template for your business. We’ve even provided a free template to get you started.
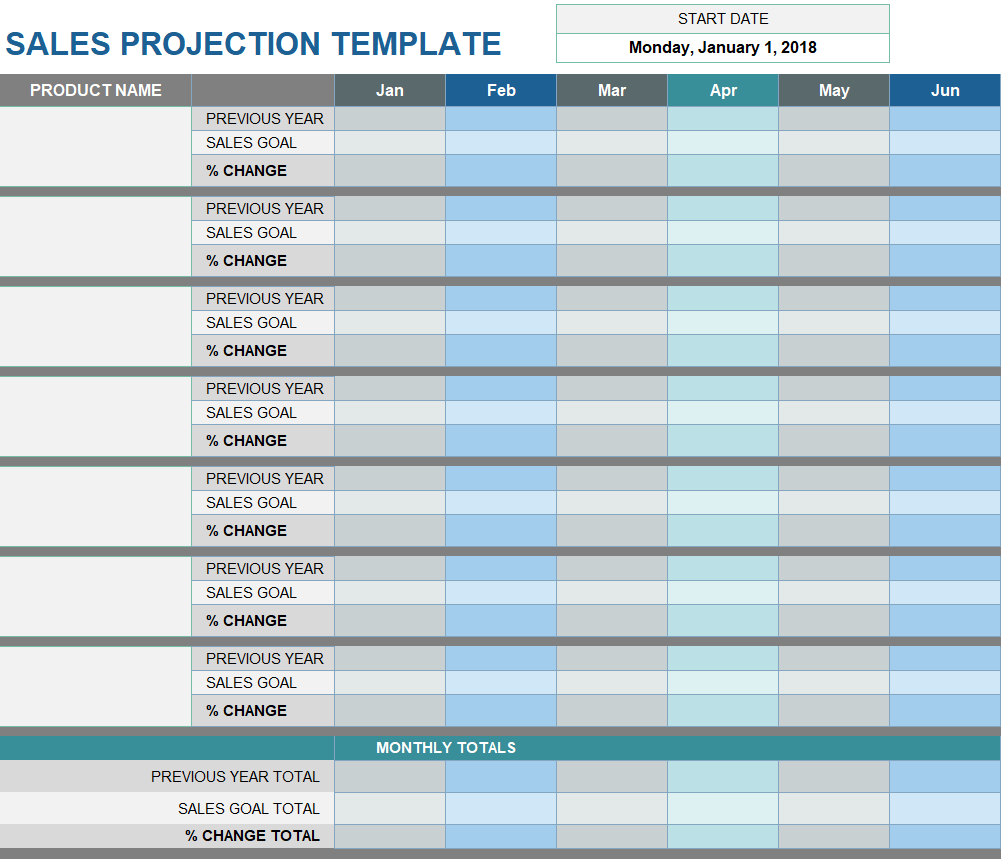
The following instructions are based on the sales projection template at the end of this article. Use the template as is, or tailor it to fit your needs.
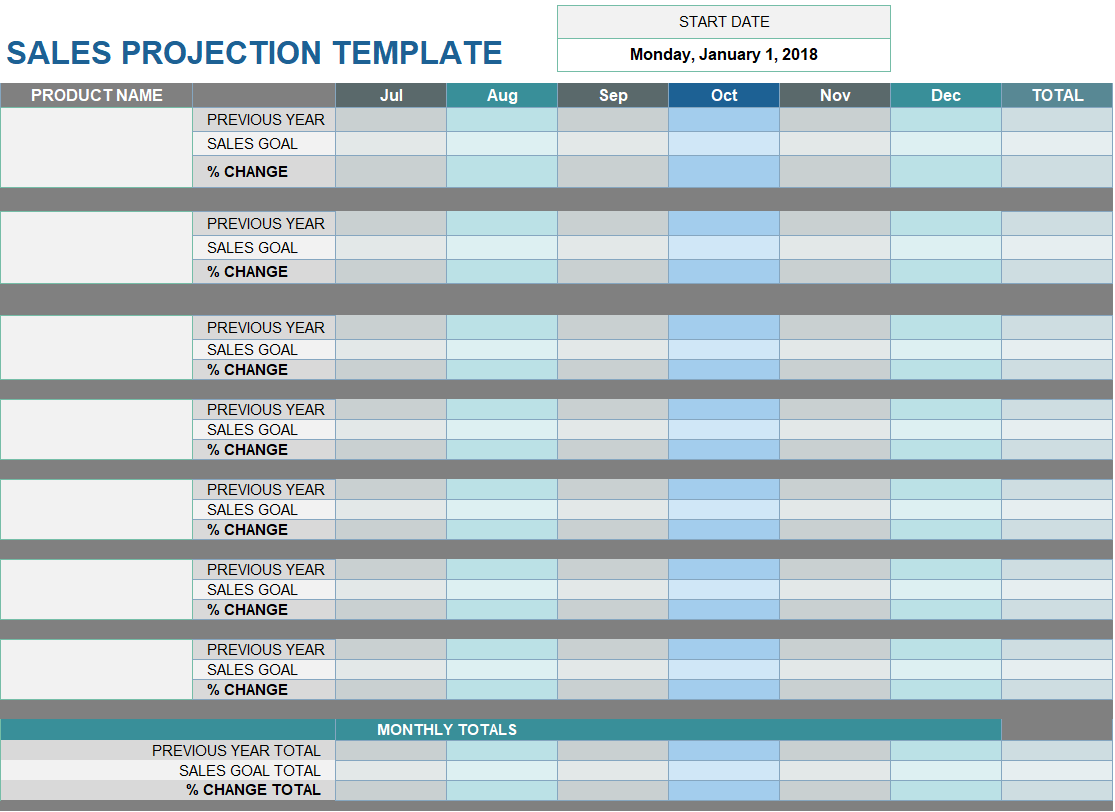
After you’ve listed each item in the Product Name column, enter the previous year’s sales data for each product in the Previous Year cell for every month. If you don’t have the data broken down by month, simply enter the total in the Total column to the right of the Dec column.
Expert tip: use Sling’s report feature to get a detailed breakdown of monies paid to your team members over the past year. You won’t include it in this sales projection template, but both sets of numbers give you a robust view of how your business is doing.
If you don’t have any previous year data at all, that’s OK. Just leave these cells blank. You won’t be able to calculate the percent change, but you’ll have the current year’s data to analyze, which you can use at the end of the year to fill in the sales projection template for next year.

We’ve titled the next row Sales Goal because you can use the numbers here to set targets for the upcoming year. If you’re not sure what those targets should be for your business, use this column to record the current year’s sales for each product. That will give you a comparison between the current year and the previous year.
Then, once you’ve gone through a full year in this manner, you can set benchmarks for each product based on two-year’s worth of data. If you’re not sure what dollar amounts you want to shoot for here but you know you want to increase sales by five percent (for example), you can skip to the next step, calculate the percent change, and then use that information to fill in the Sales Goal cells.
Percent change is basically the difference between two-year’s worth of sales expressed as a percentage. Below is the formula for calculating percent change.
% Change = (Current Year Sales or Sales Goal – Previous Year Sales) / Previous Year Sales
Let’s say that your Previous Year sales for pens in January was $34,654 and your Sales Goal (or current year sales) for January is $49,219. To calculate the % Change, plug those numbers into the equation. Here’s what it looks like with the data inserted:
% Change = ($49,219 – $34,654) / $34,654
As we learned in high school math, always do the operation in parentheses first. That gives us:
$49,219 – $34,654 = $14,565
Plug that back into the equation and you get:
% Change = $14,565 / $34,654
The forward slash ( / ) stands for divide, so after you perform that operation, you’re left with:
% Change = 0.42
So the percent change between last year and this year is a 42-percent increase. If your sales went down from one year to the next, your percent change will be a decrease.

In step three, we mentioned that you could leave the Sales Goal cell blank and just enter a percentage you want to shoot for. You can use that percent change goal to calculate an exact number for your sales projection template. Here’s how to use the percent change equation to fill in the Sales Goal cell.
6/100 = (X – $34,654) / $34,654
First, convert your target percent into decimal form by dividing by 100 (6/100 = 0.06). Then, move values around to get X by itself on one side of the equal sign. Do this by first multiplying both sides by $34,654. That cancels out the number to the right of the division sign and gives you:
$34,654 * 0.06 = X – $34,654
Doing that math gives you:
$2,079.24 = X – $34,654
Now just add $34,654 to both sides and you get:
$36,733.24 = X
If you’ve set your sights on increasing sales by six percent over last year, the total dollar value you should be shooting for is $36,733. You can insert that number into the Sales Goal cell for January.
At the end of every month, add up the information for each product and record it as a Monthly Total at the bottom of the sales projection template. This will give you a total monthly sales value that you can use to forecast for the following year.
When you have all the data for the year, add up all twelve numbers (Jan-Dec) for the Previous Year, Sales Goal, and % Change rows. This will show you:
You can then use that information to project twelve months into the future.

The information produced by the sales projection template gives you powerful insight into the sales trends your business is facing. You can use the data from the template to decide such things as:
You can then combine these numbers with inventory numbers, employee statistics, and other data points to get a well-rounded picture of your business’s short-term future.
The best way to gather employee statistics is by using the Sling app. Sling provides powerful control over scheduling, clocking in and out, assigning tasks, and team communication. It also contains detailed reports that you can use along with the sales projection template to plan ahead.
Below is a free sales projection template you can use to get the full picture of where your business is headed. Incorporate it with the instructions above to keep your business running in the black.
For more free resources to help you manage your business better, organize and schedule your team, and track and calculate labor costs, visit GetSling.com today.


See Here For Last Updated Dates: Link
This content is for informational purposes and is not intended as legal, tax, HR, or any other professional advice. Please contact an attorney or other professional for specific advice.
Schedule faster, communicate better, get things done.